Instance Auditor (Jira) has become even more visual! Below are the new stunning charts that provide a wealth of information that cannot be easily found natively in Jirais essential to the success of any Jira administrator and keeping a healthy, optimally running instance.
Each chart is a summation of specific areas that either don’t exist natively in Jira or is cumbersome to pull together manually.
Totals are provided in the titles of each chart.
Hover over any of the chart areas to see the current totals for that specific item.
| Info |
|---|
NOTE: Below are images of the charts that are available at this time. More report charts will be coming in the near future. Some of these awesome new charts provide key metrics that cannot be found in Jira natively! Breakdowns such as Boards (Simple vs Scrum vs Kanban) and Projects (Classic vs Next-gen) and much more! |
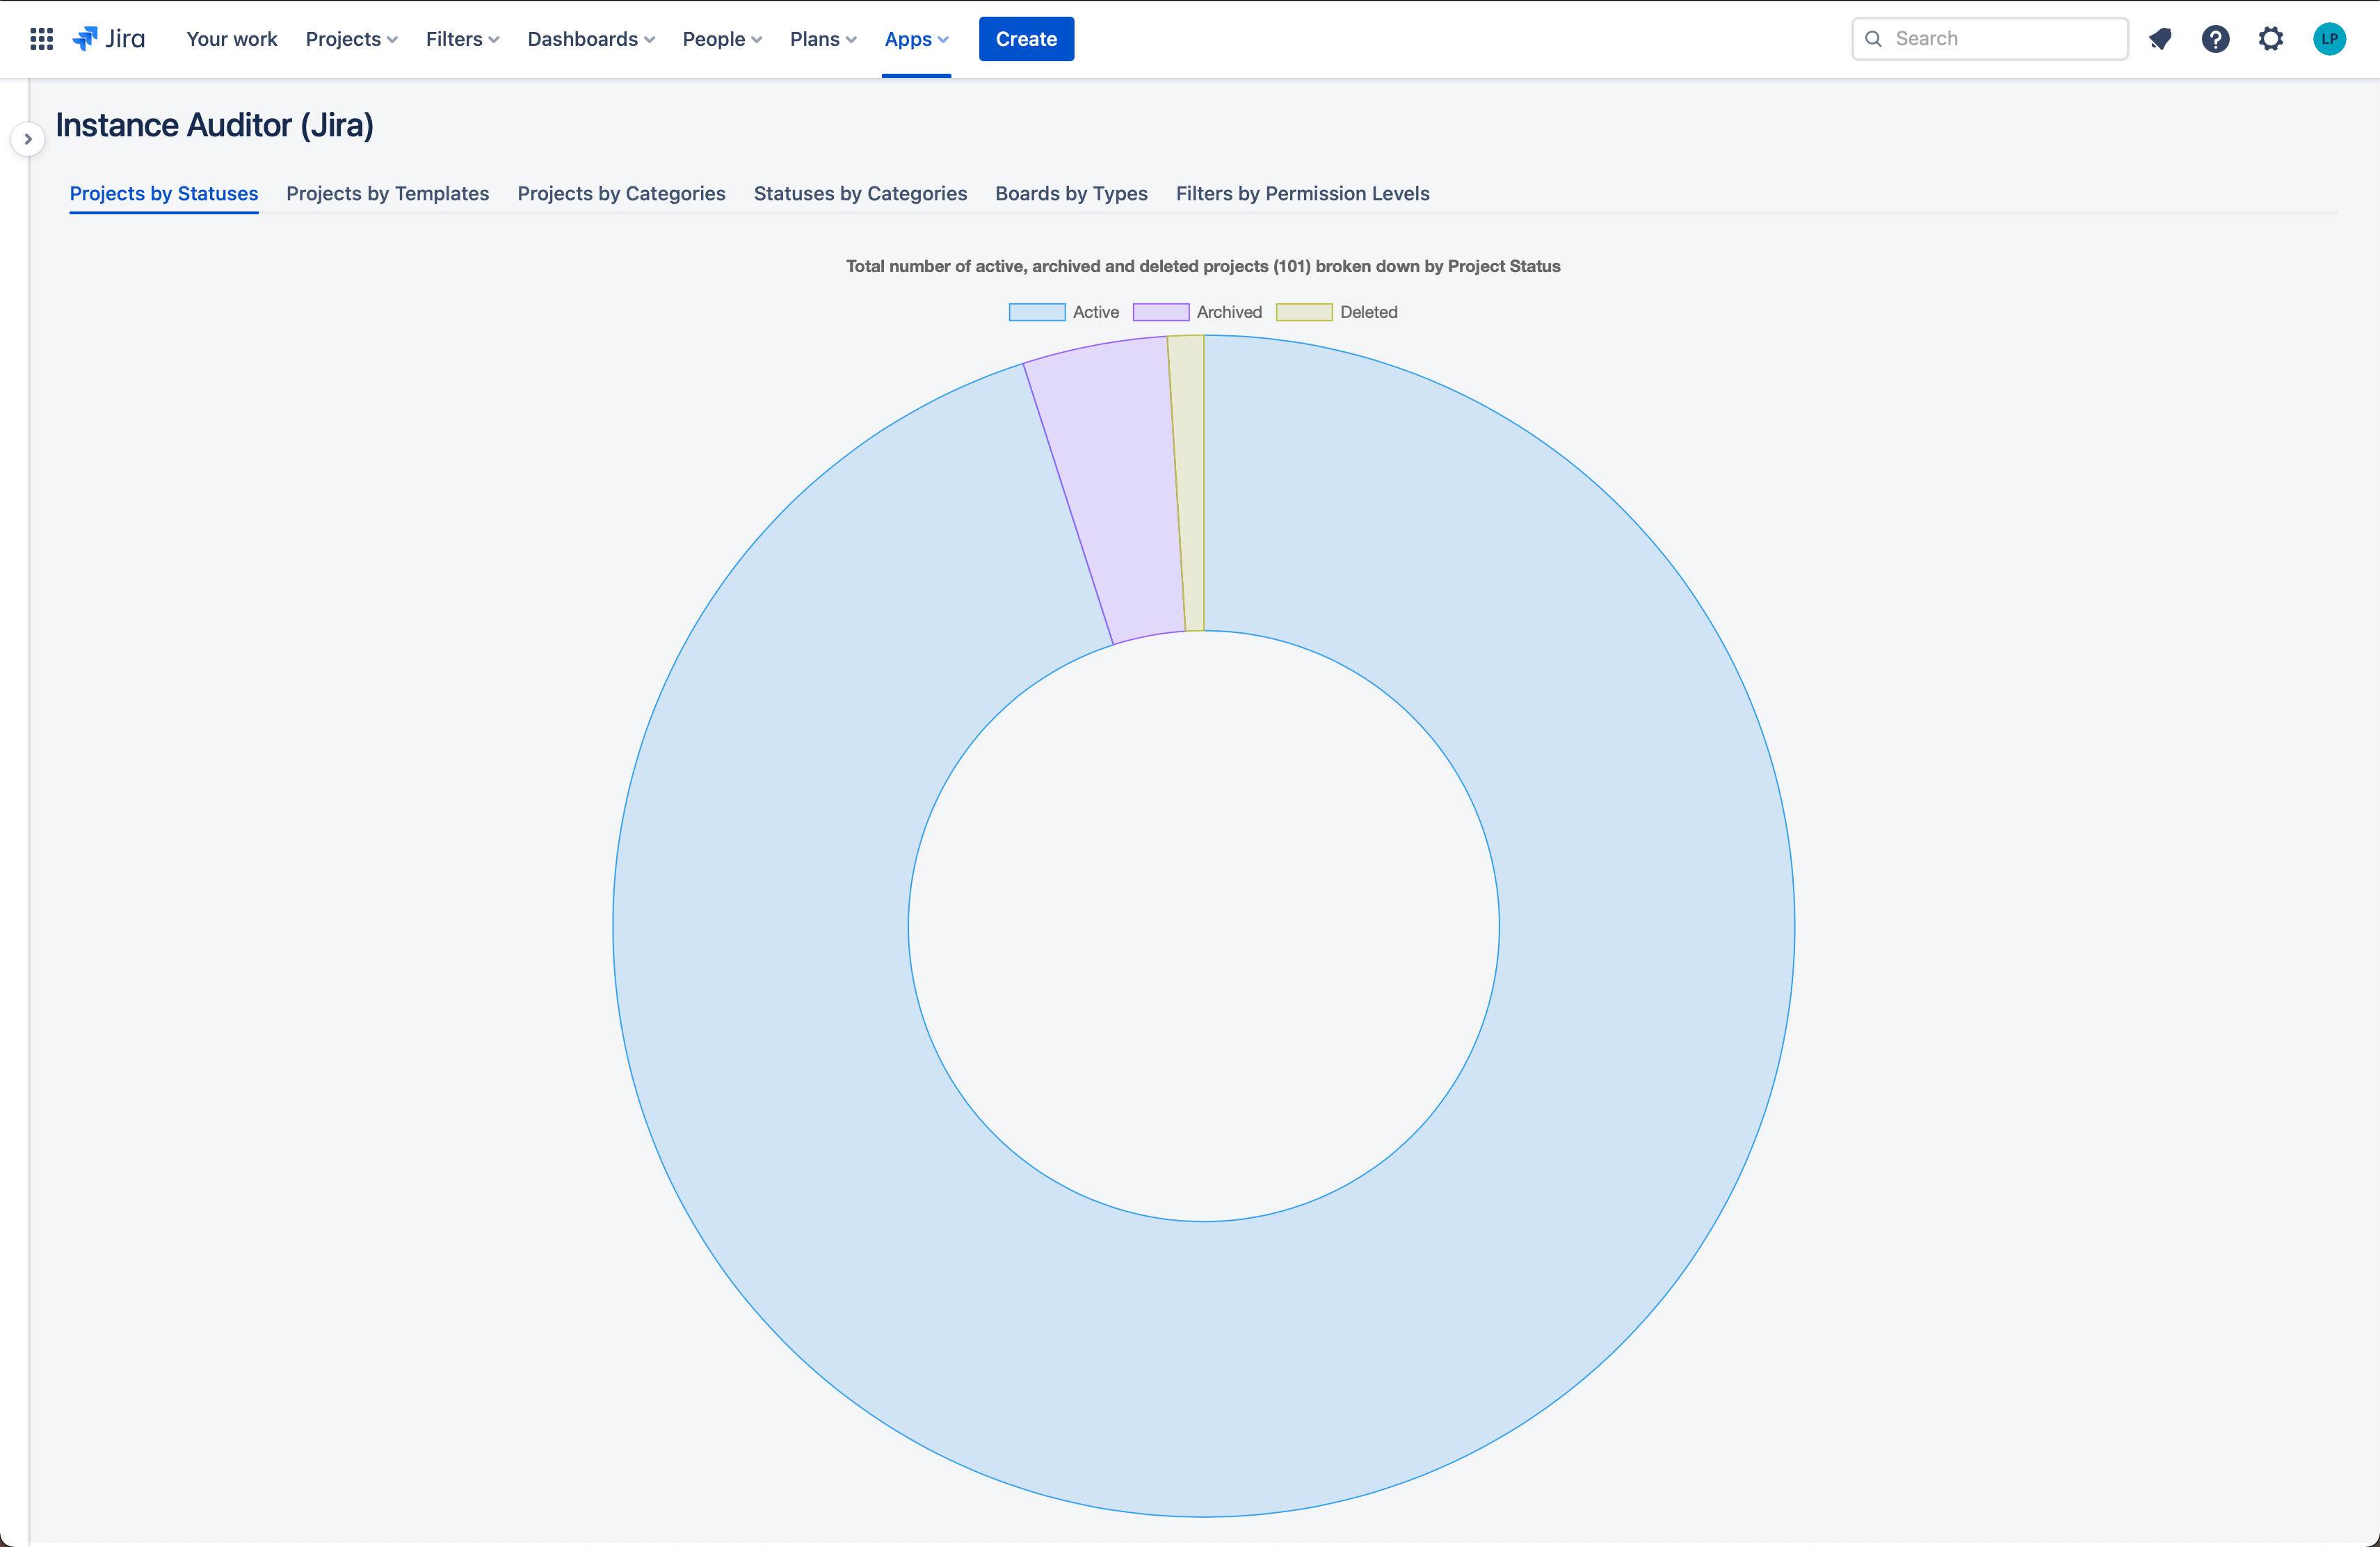
Screenshot #1: See a breakdown of all of the projects in your instance by their status (Active, Archived and Deleted).
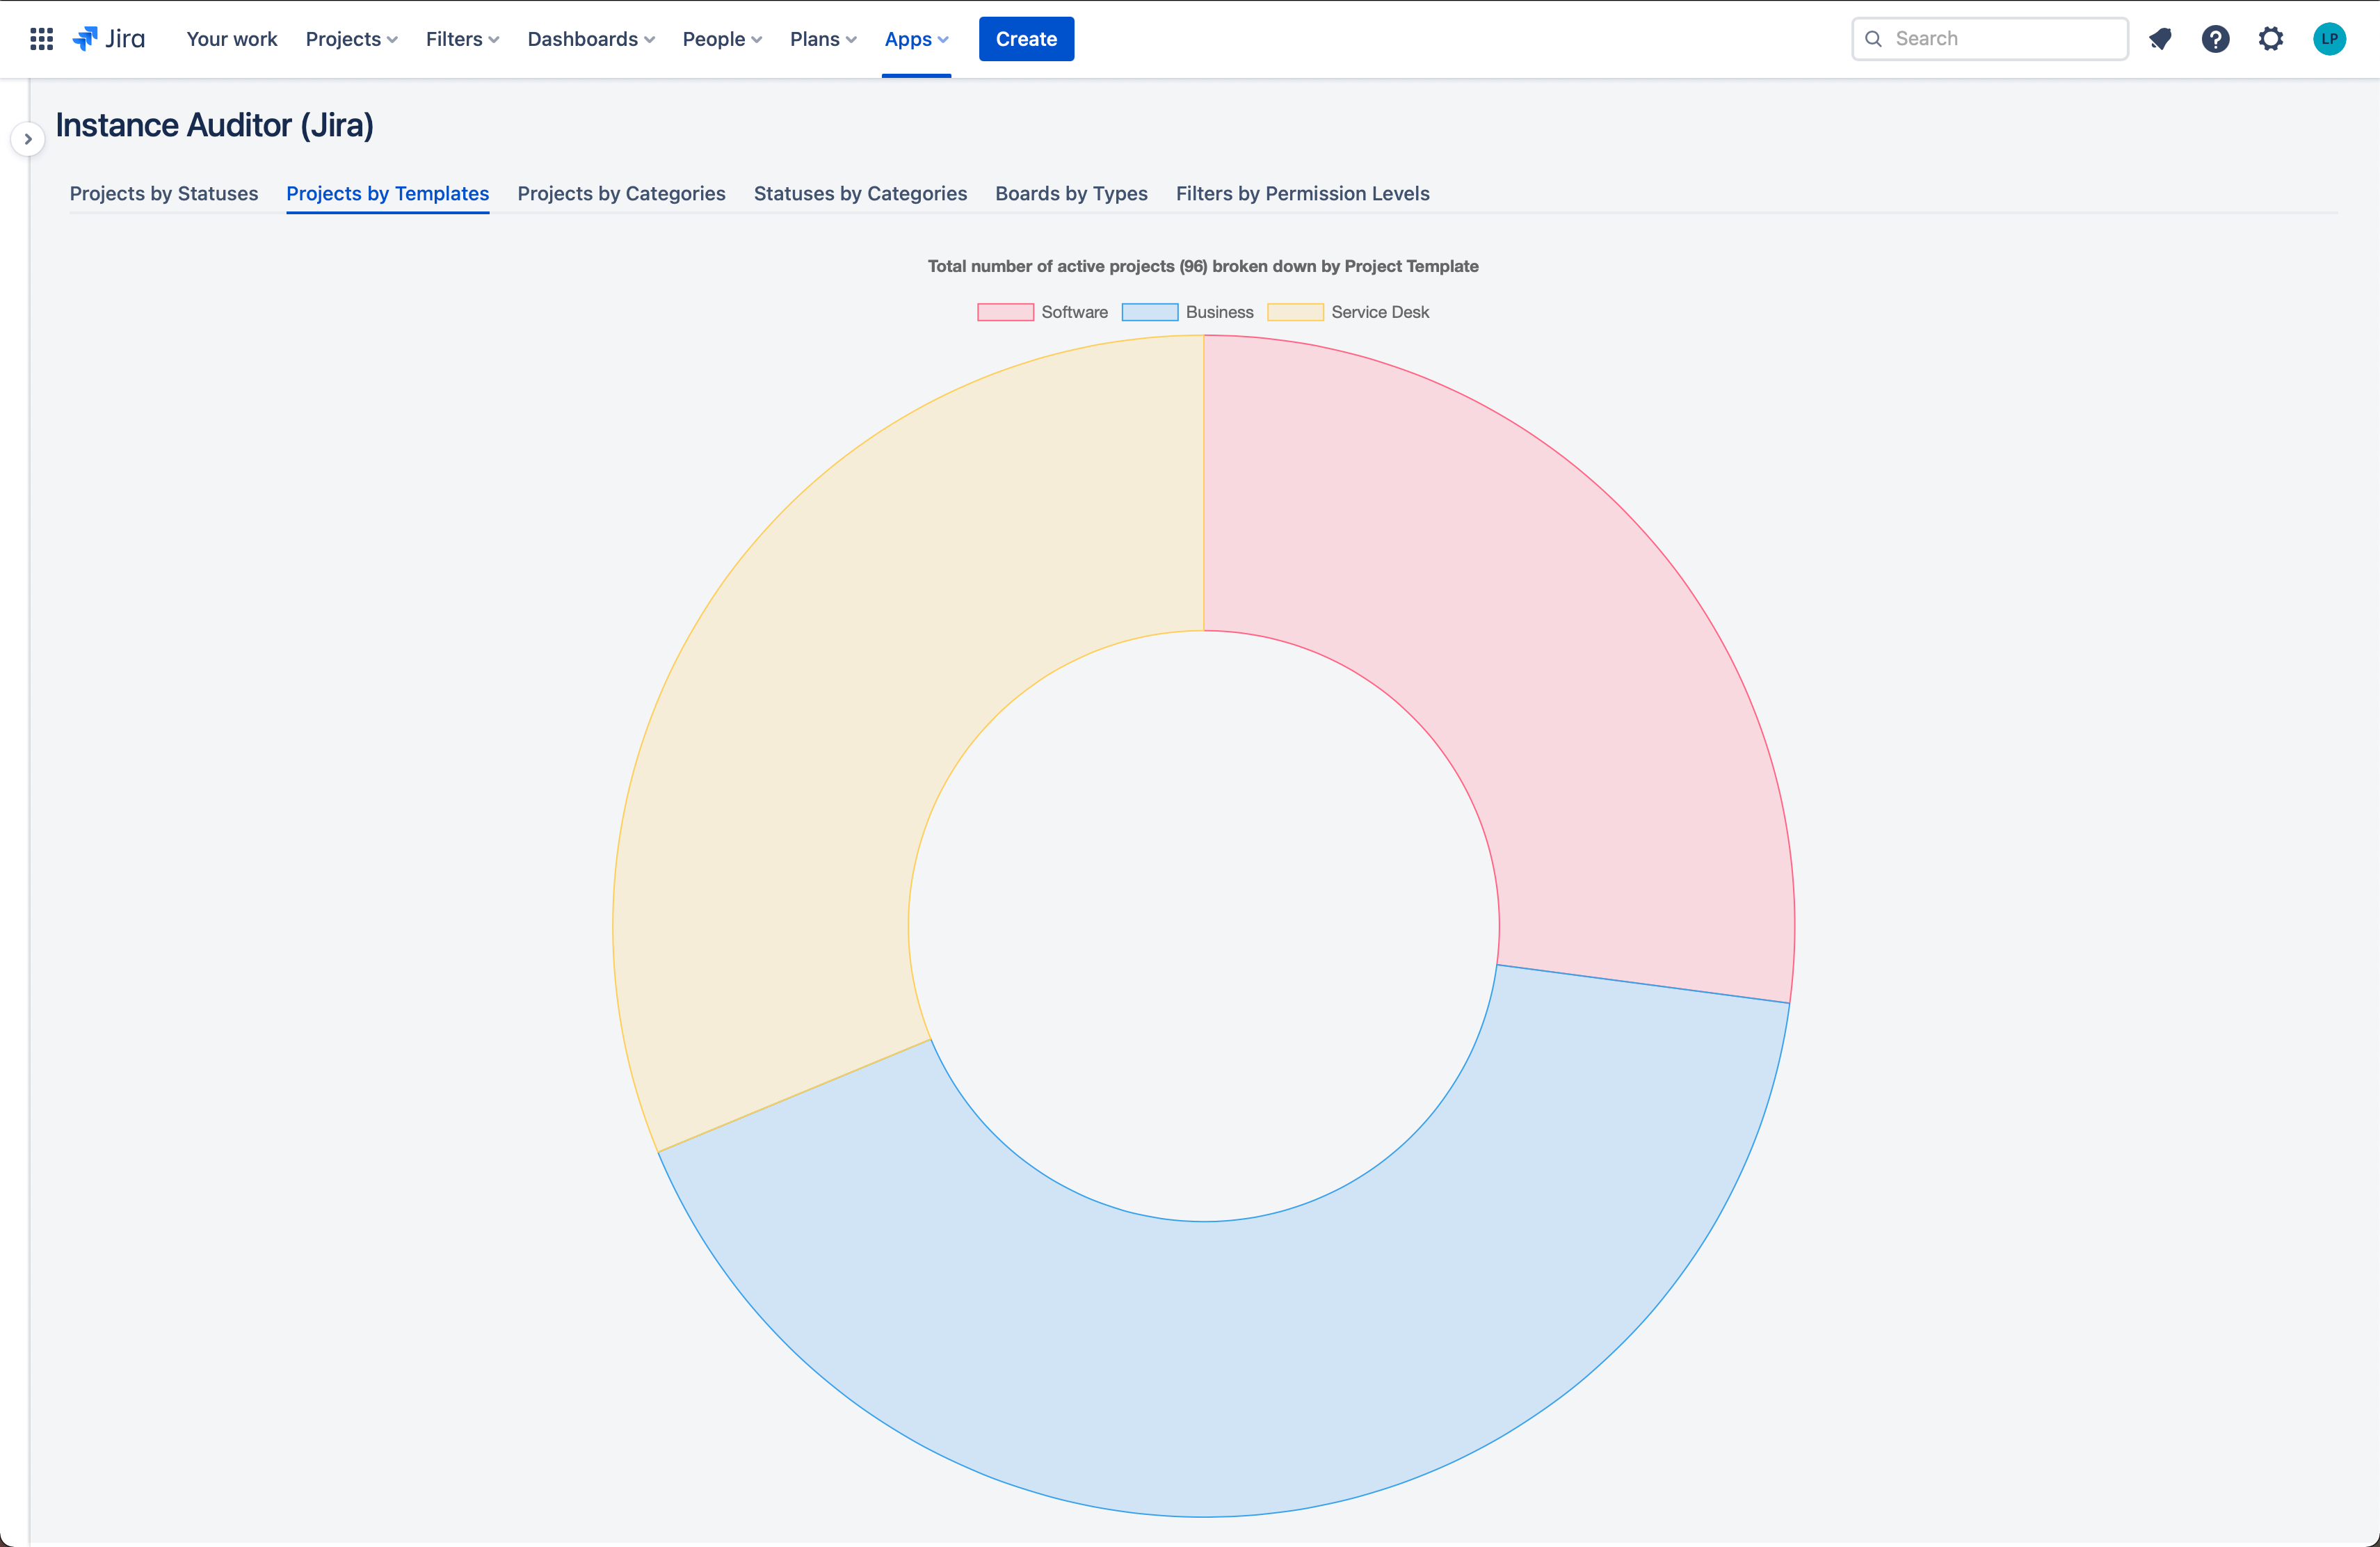
Screenshot #2: Use this chart to determine the logical breakdown of the active projects in your instance (Software, Business and Service Desk).
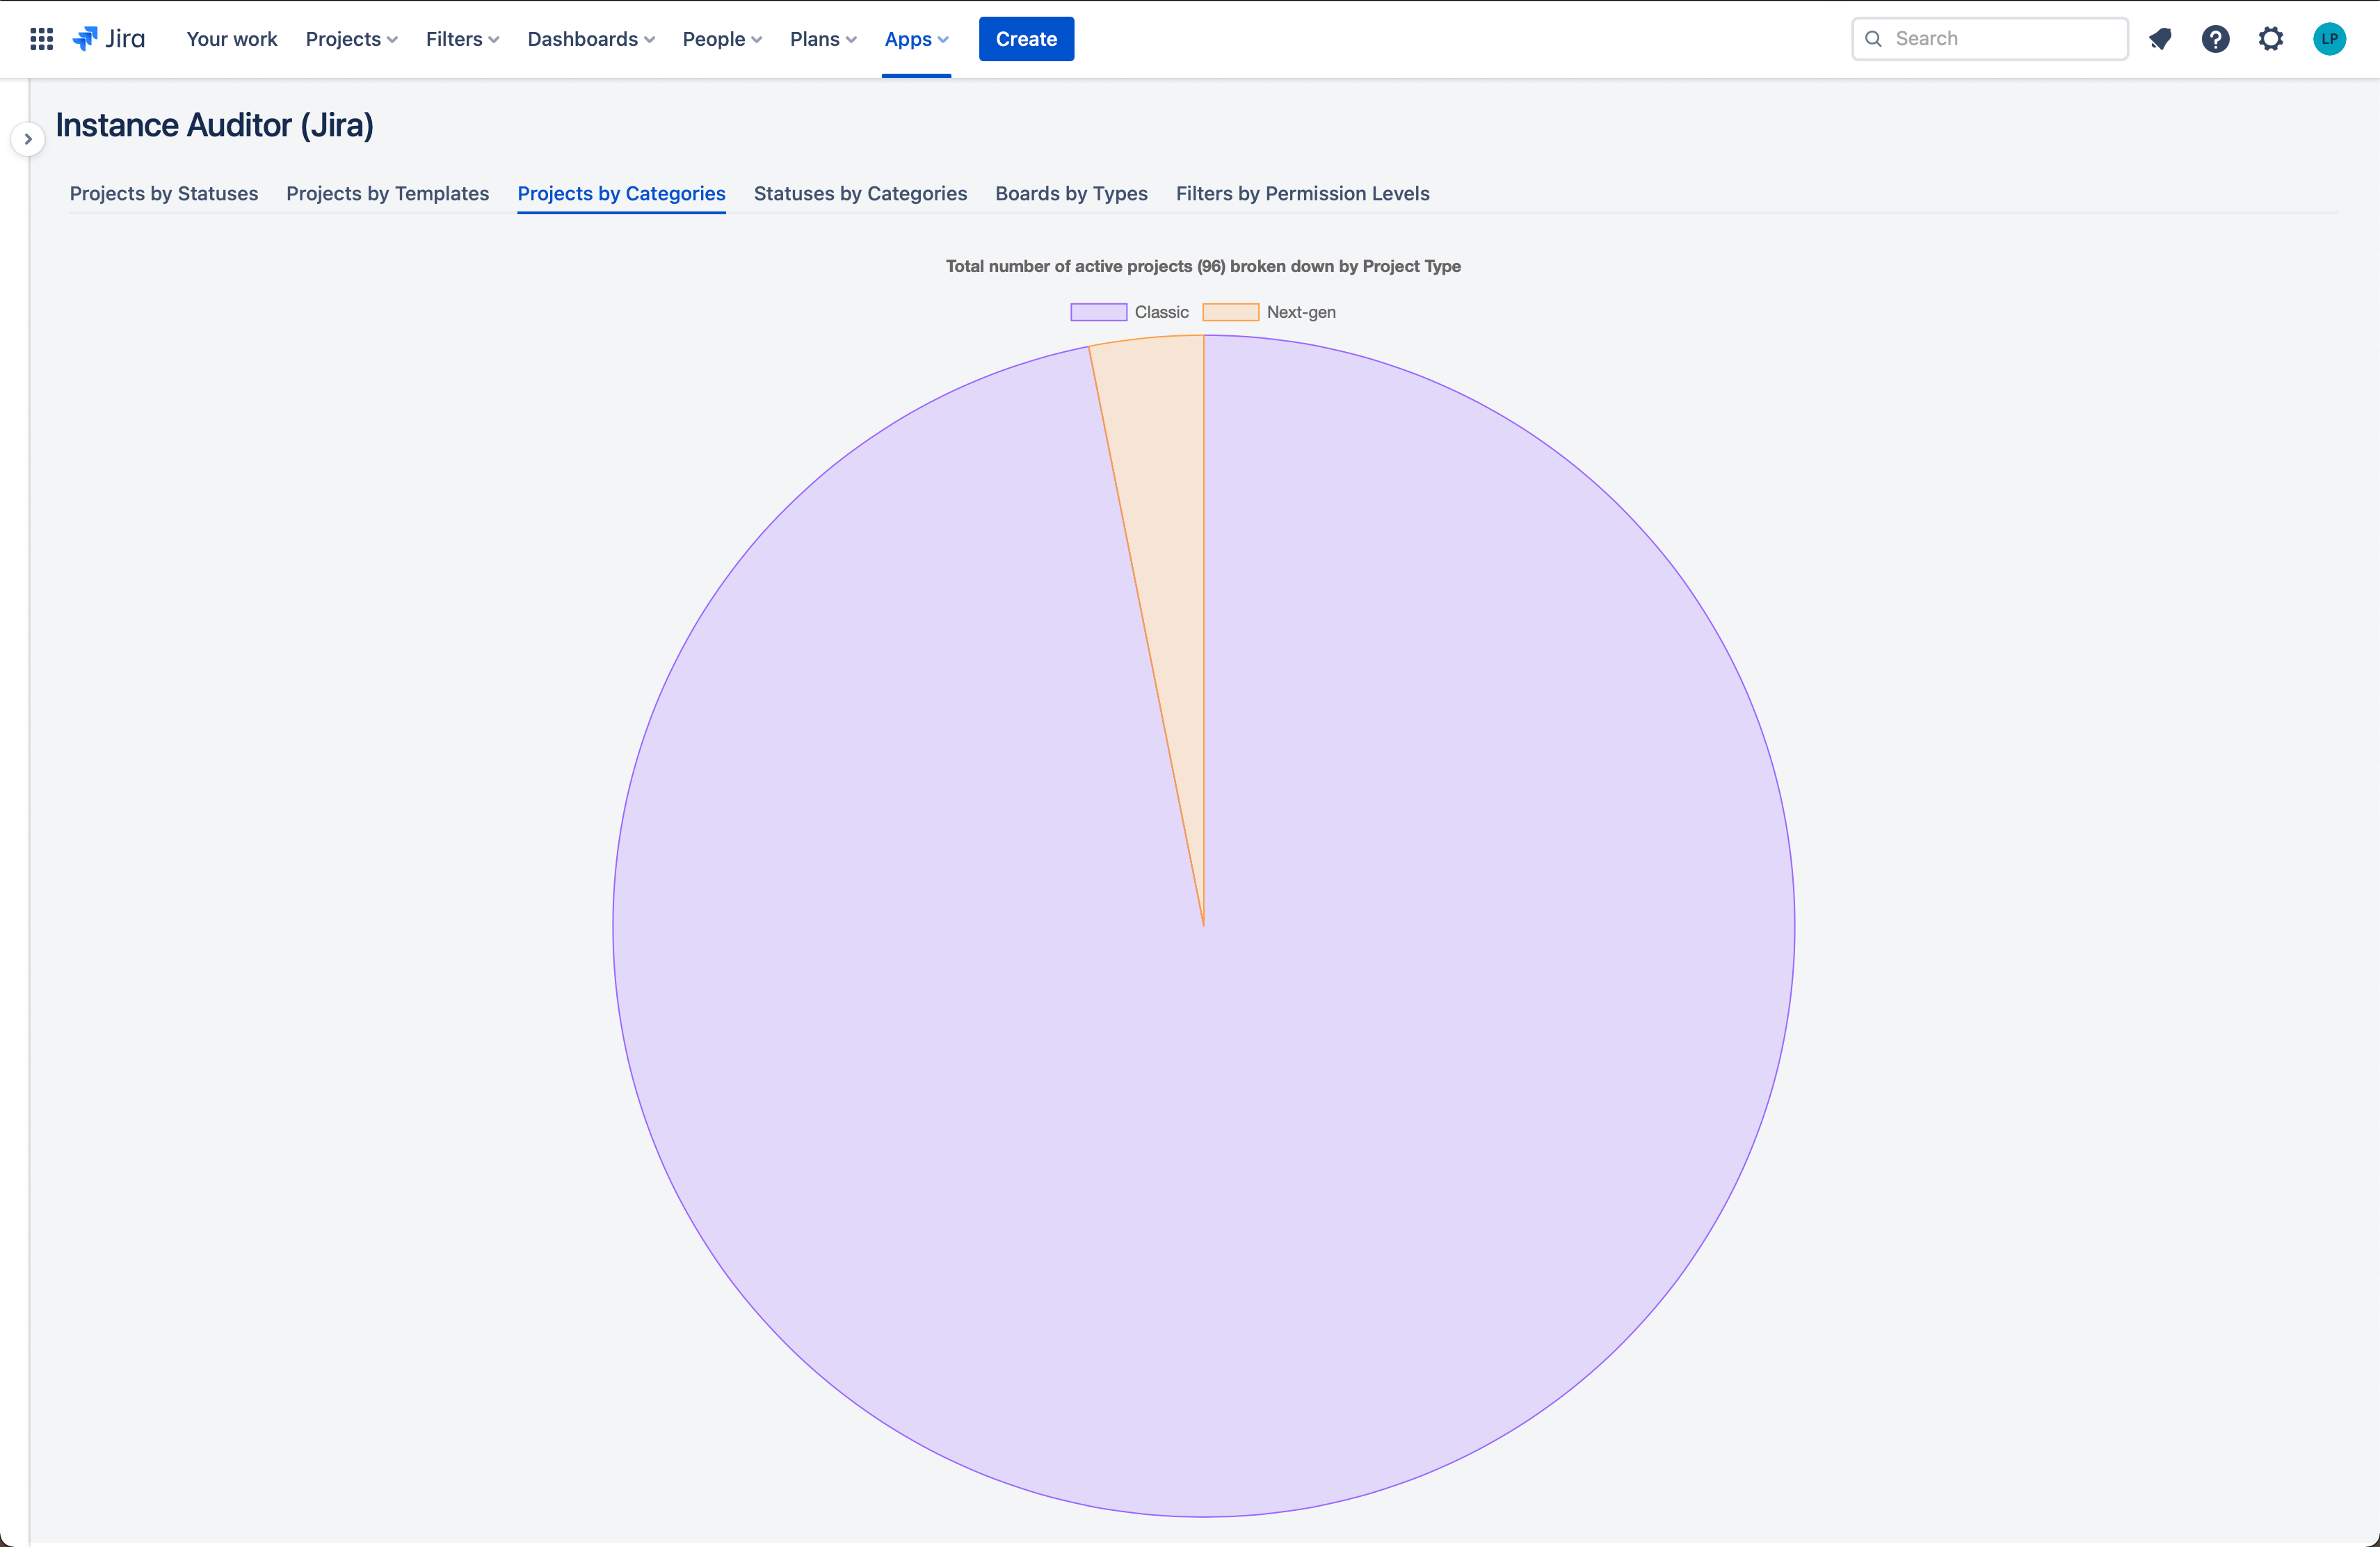
Screenshot #3: There is not an easy way to see a breakdown of Classic vs Next-gen projects natively so we added our own chart to cover this gap.
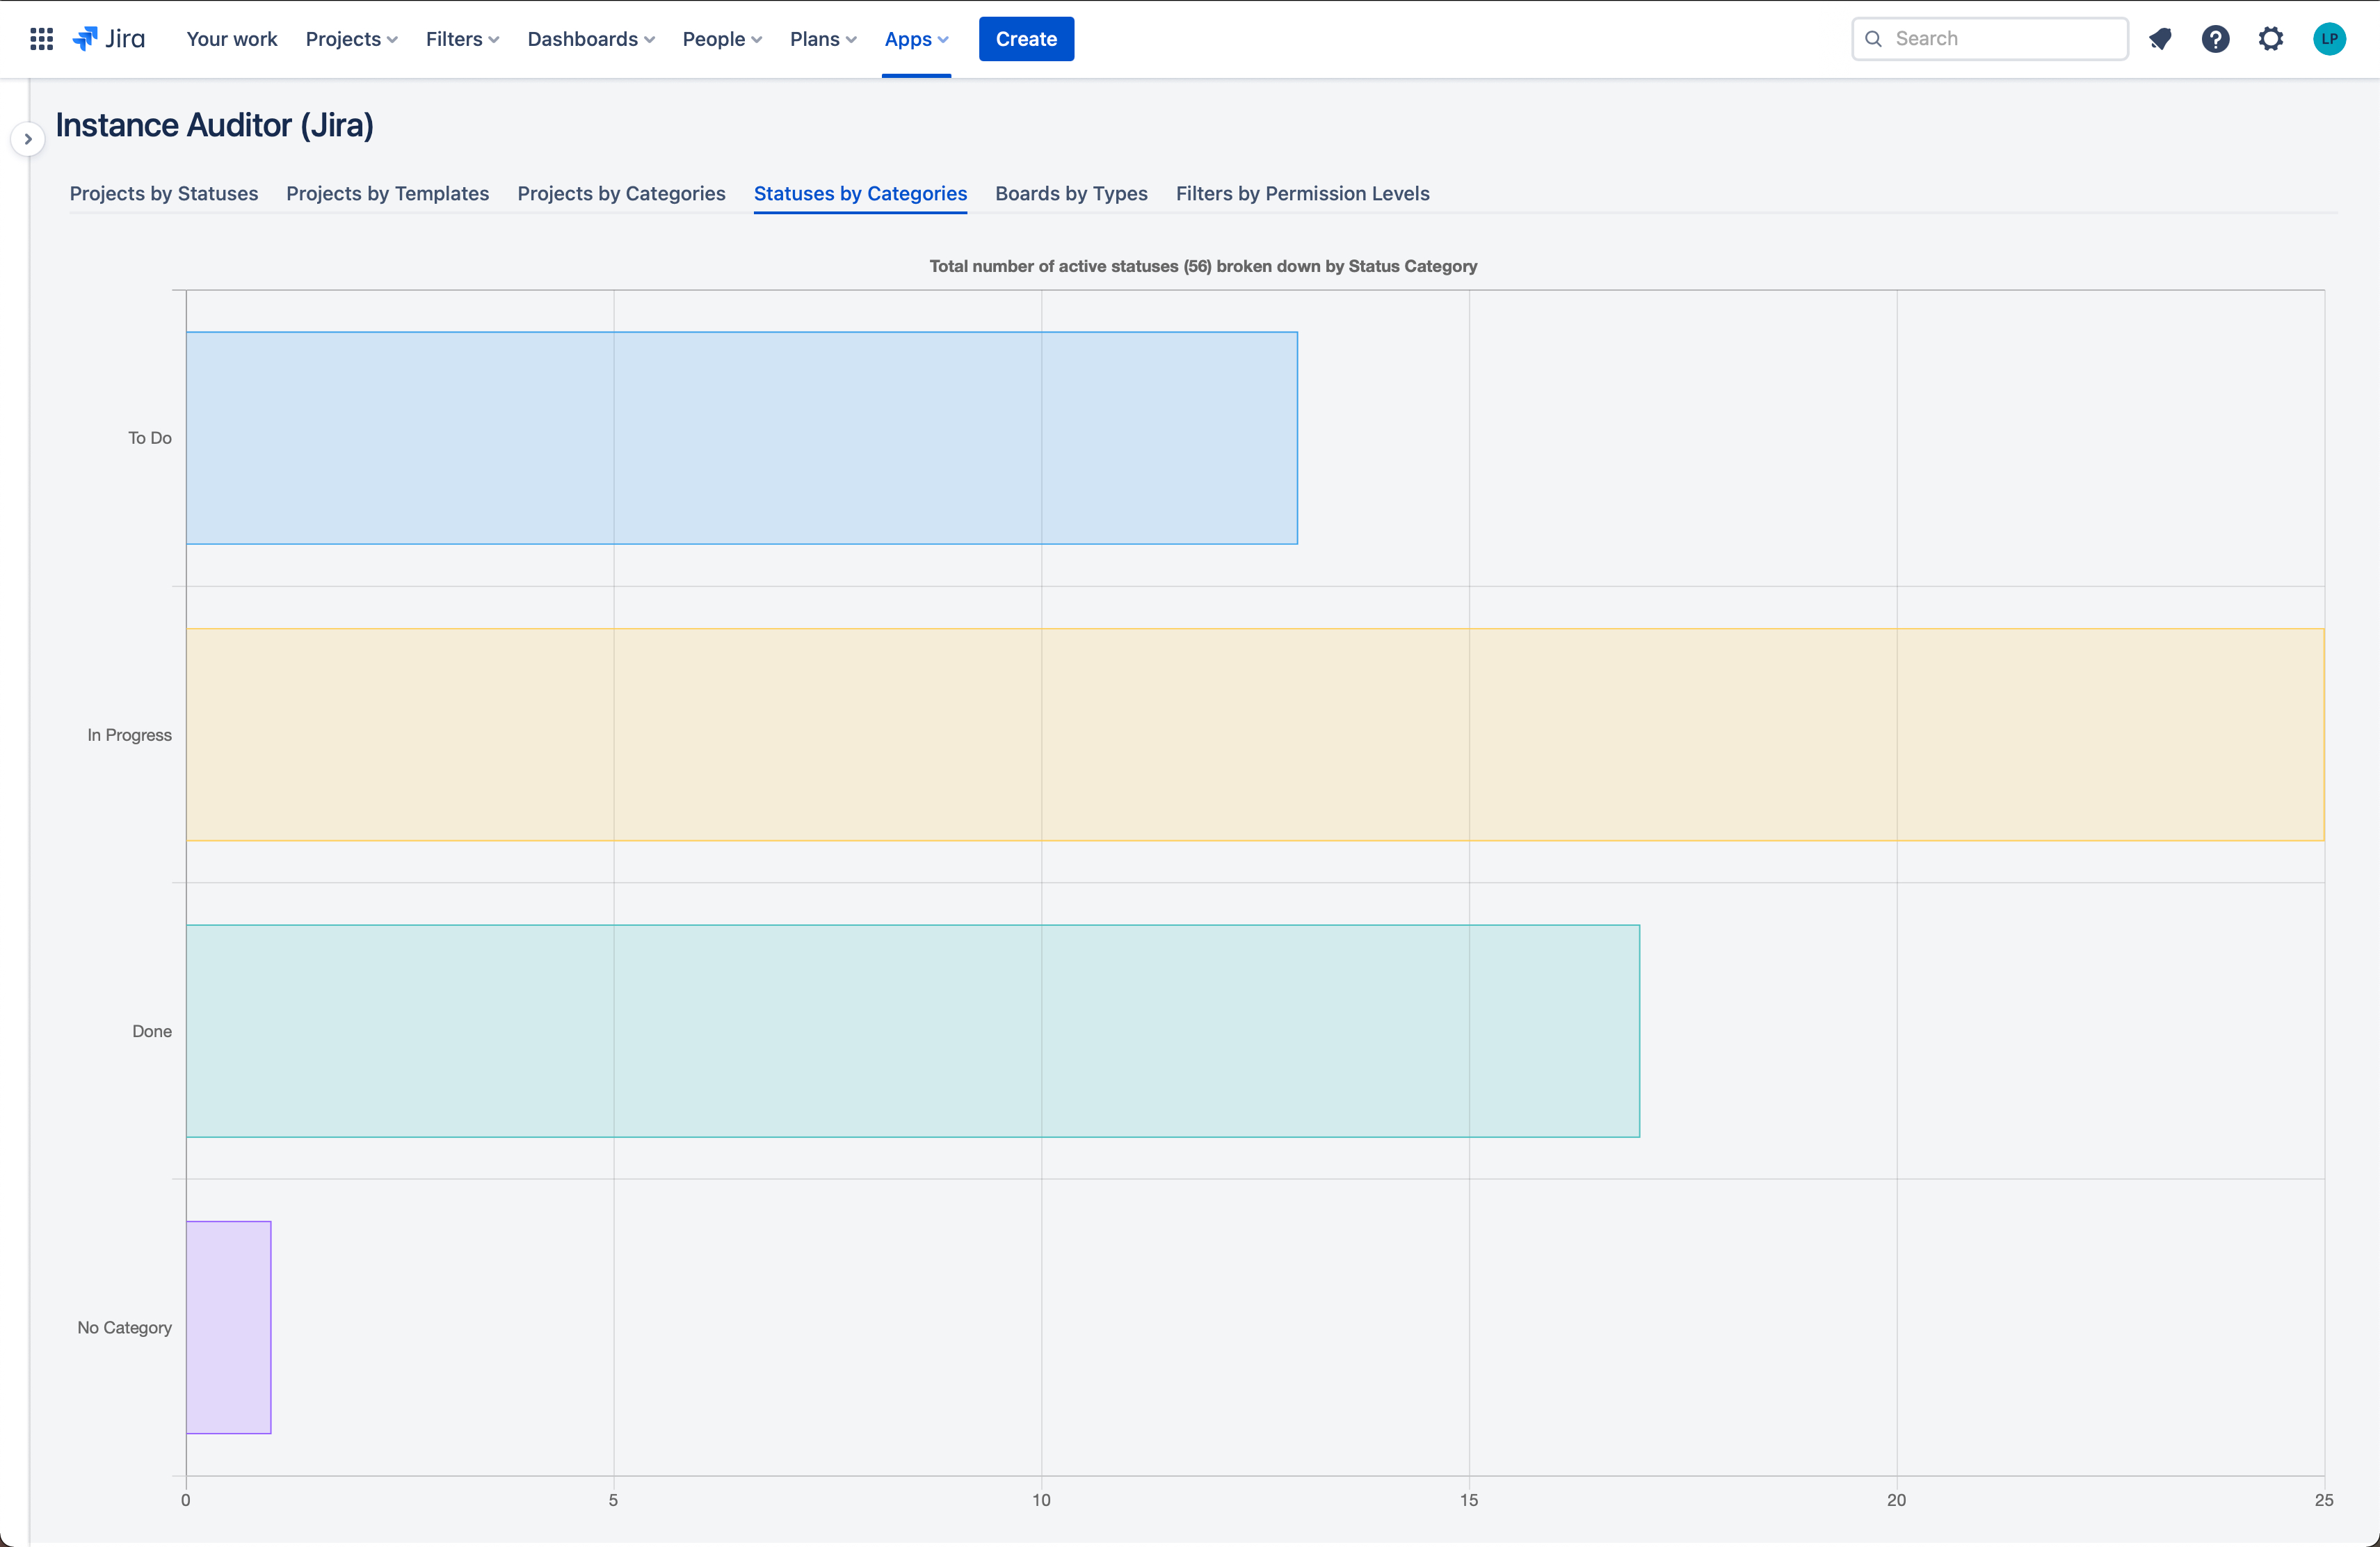
Screenshot #4: See a breakdown of your active statuses by their status category. Identify active statuses that need a category assigned.
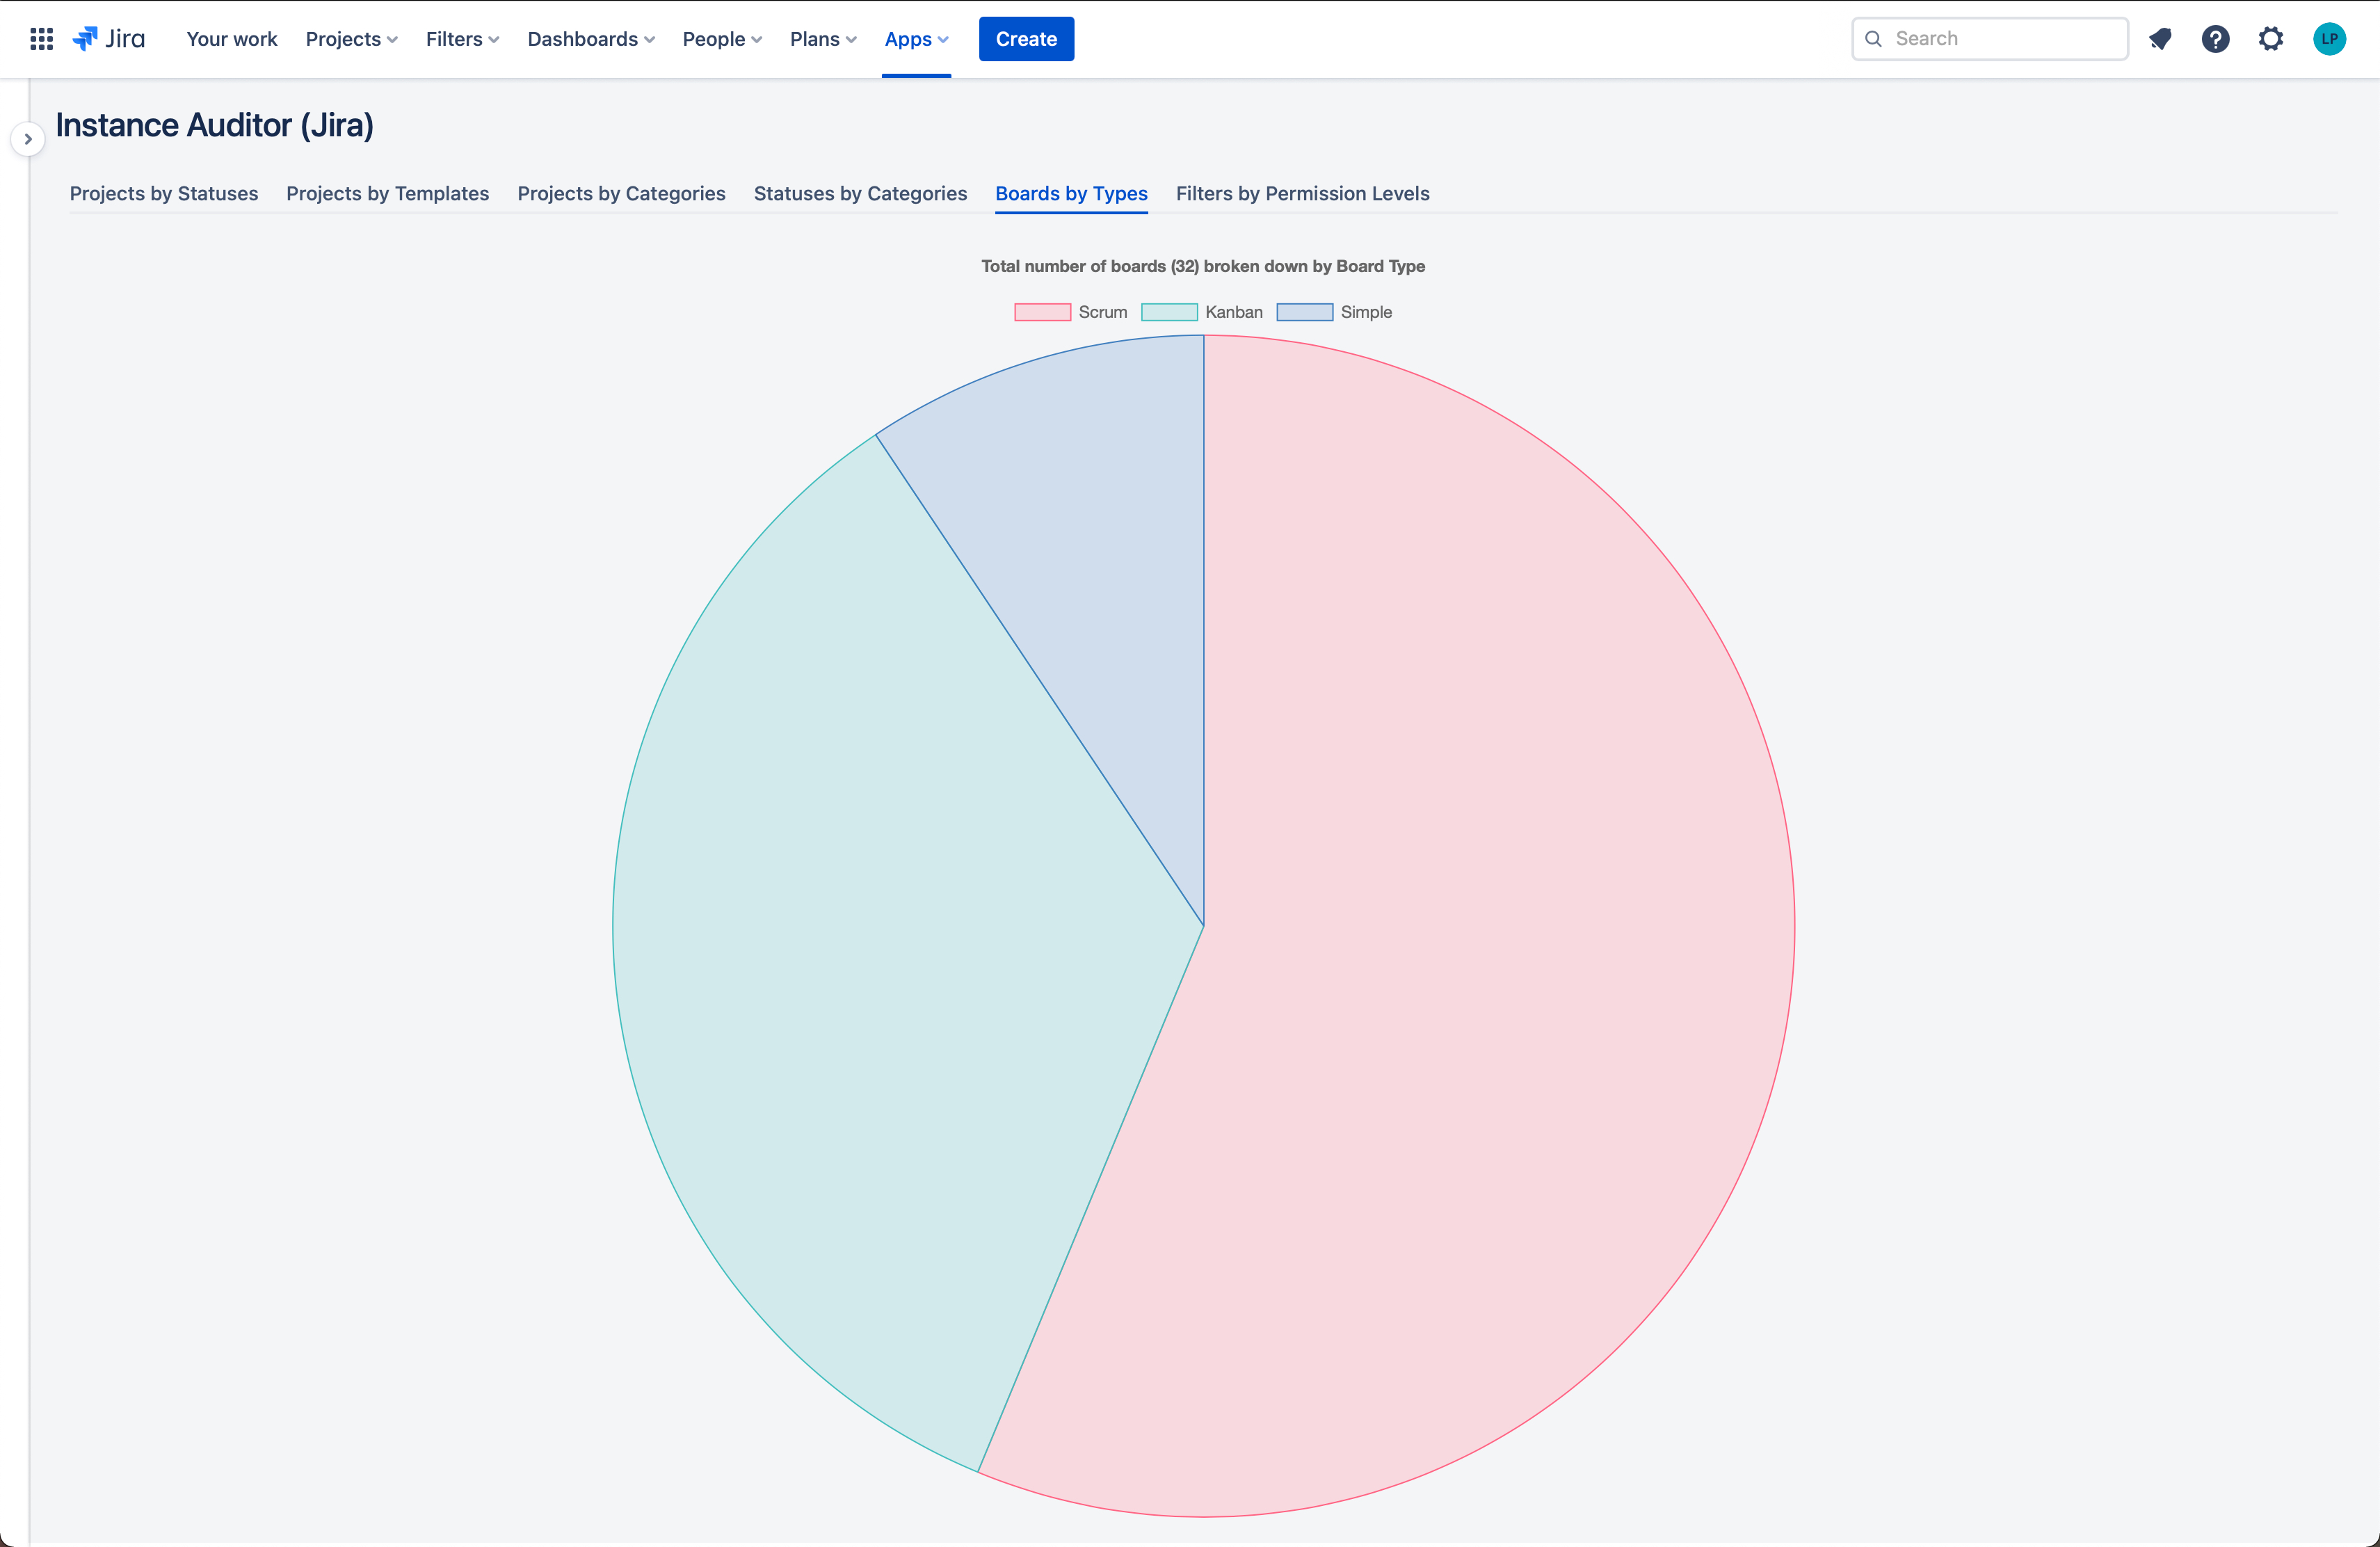
Screenshot #5: Customers have hundreds of boards, so this chart provides and easy way to see a breakdown of Simple, Scrum and Kanban boards.
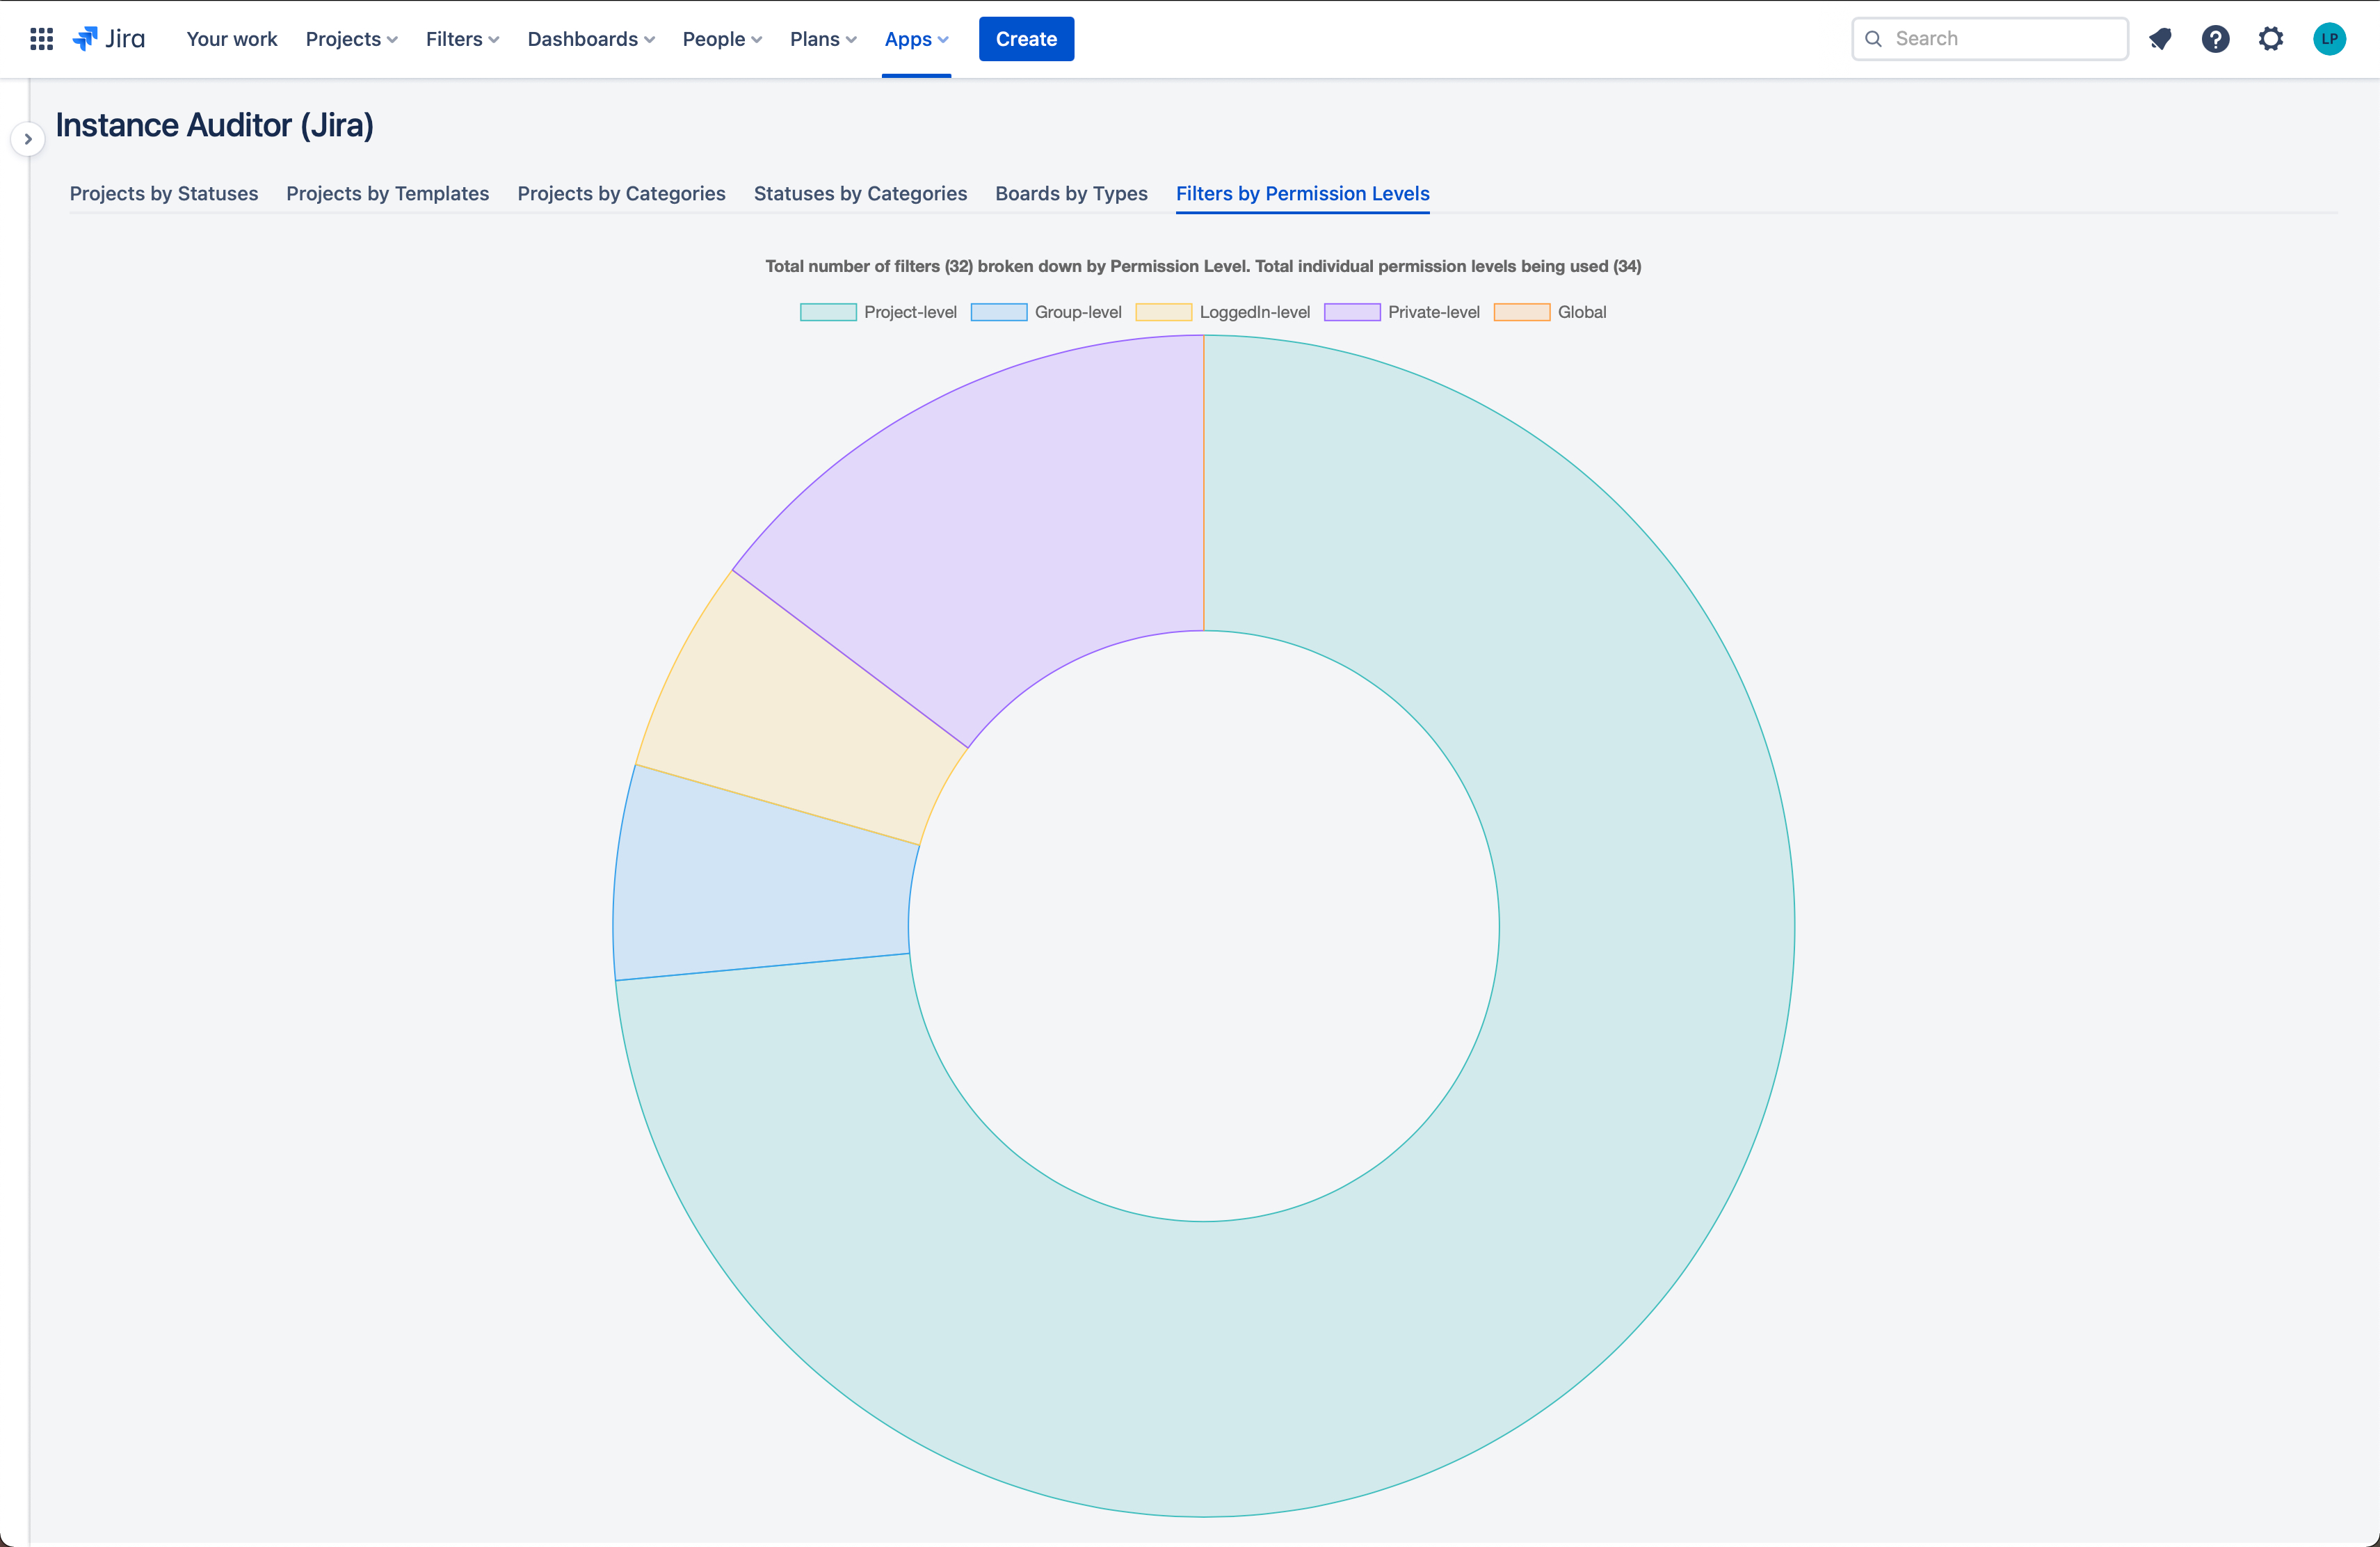
Screenshot #6: 1000s of Filters with no way of knowing which Permission Level is being used the most. This chart displays that breakdown for you.